Energy Monitoring
Smart Panel can track energy consumption and production from your devices, giving you insights into how much power your home uses and where it goes.
Energy monitoring works automatically — there is no admin interface to configure. As long as your devices report energy data, the panel collects and displays it.
How It Works
The energy module collects readings from devices that report power usage (e.g., smart plugs, energy meters) and stores them as 5-minute interval deltas. The panel display then shows three levels of insight:
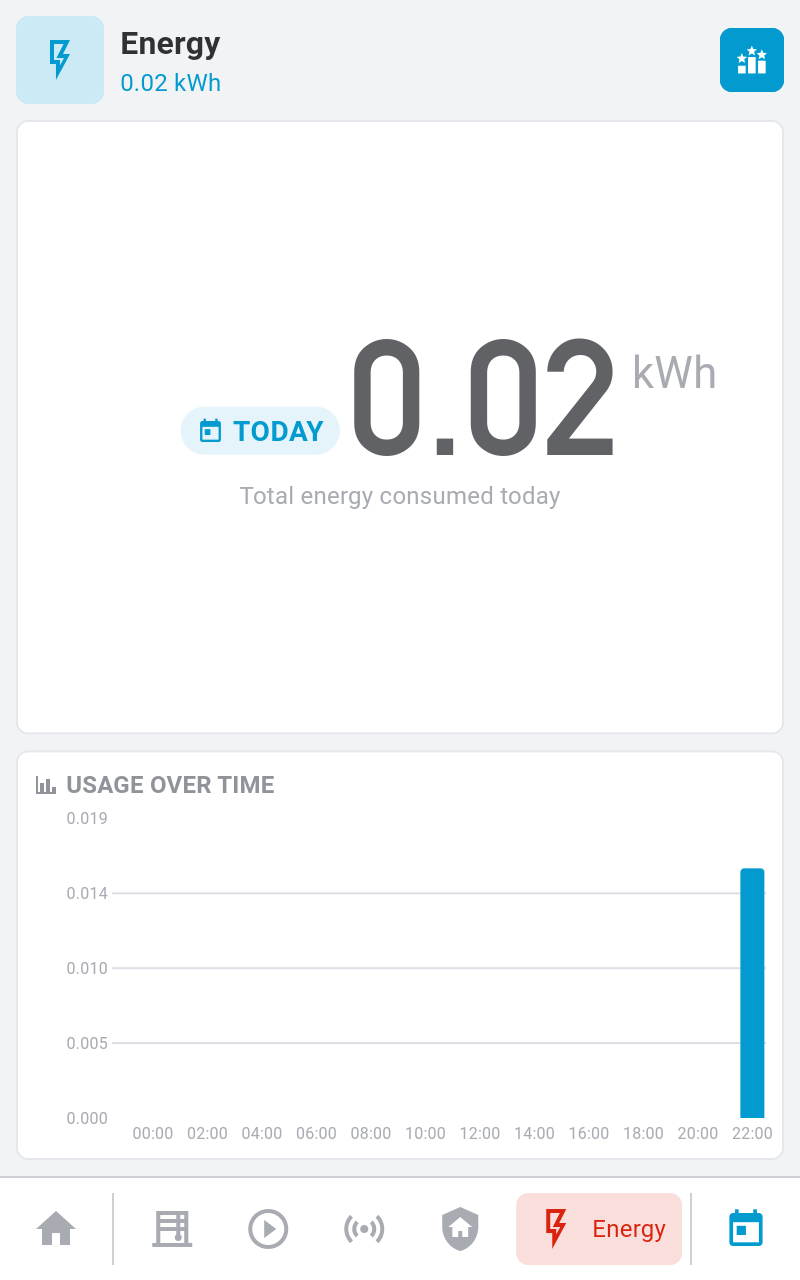
- Summary — total consumption and production for a time range
- Time series — consumption over time as charts and graphs
- Breakdown — which devices consume the most energy
All data collection and aggregation happens in the background. Results are visible directly on the panel display’s Energy screen for each room.
Requirements
Energy monitoring requires:
- Devices that report energy data — smart plugs with energy metering, dedicated energy monitors, or integrations (like Home Assistant) that expose energy properties
- InfluxDB (recommended) — for efficient time-series storage. Without InfluxDB, data is stored in SQLite which works but is less efficient for large datasets
To enable InfluxDB, see the Docker installation guide
or add InfluxDB settings to your config.yaml.
Energy Sources
The system tracks four types of energy flow:
| Source Type | Description |
|---|---|
| Consumption (Import) | Energy consumed by your devices |
| Generation (Production) | Energy produced (e.g., solar panels) |
| Grid Import | Energy drawn from the utility grid |
| Grid Export | Energy exported back to the grid |
Data Retention
Energy data is retained for 90 days by default. Older data is automatically cleaned up.
What’s Next?
- Learn about Spaces to organize energy data by room
- Explore the API Reference for programmatic access to energy data